● Research / 2023—2026Lawrence Berkeley National LabUPenn
Research
I build low-cost sensors that turn everyday signals into real data,
and I spend just as much time finding out where they get it wrong.
FocusAI Sensing / IAQ
PartnersLBNL · UPenn
StatusActive — ISES 2026
OutputSensor · dataset · paper
Scroll to continue
01FeaturedLawrence Berkeley National Lab
An AI sensor that reads the stove.
StoveCam
A small camera that watches the stove and works out when someone's
cooking, what is in the pan, and how it's being cooked. That
record is exactly what air-quality researchers need, and it costs a tiny
fraction of what proper lab instruments do.
40k+
RGB + thermal pairs across three homes
8.1/10
Mean human-graded identification accuracy
$0.018
AI cost per analyzed pair
3-stage
Pipeline that spends AI where it counts
What it is
A Raspberry Pi above the stove with two cameras — one normal, one thermal — photographing the cooktop every minute.
How it works
Three AI stages: throw away dark frames for free, screen for cooking cheaply, then have a top model write down food, method, burner, and cookware.
Why it matters
Cooking is one of the biggest indoor air pollutants, and this record is what exposure researchers need — at sensor prices, not lab prices.
01
The problem
Cooking is one of the biggest sources of indoor air pollution, and it's
surprisingly hard to track. To model it, researchers need to know how often a
home cooks, on which burner, how, and for how long. Asking people to write it
down doesn't really work, and the lab-grade gear that measures it properly is
way too expensive to put in a lot of homes. StoveCam started as a side question
from our earlier air-quality work at LBNL:
could a cheap camera and an AI model just figure the cooking out by
watching?
02
The sensor: two cameras, one stove
Each unit is a Raspberry Pi 5 sitting above the stove with two
cameras: a normal RGB camera and an Adafruit thermal
camera. Every 60 seconds it takes a picture with both and saves the
pair. The two cameras are doing different jobs on purpose. The normal photo shows
what's on the stove. The thermal photo shows what the normal one can't — heat
under a lid, a pan that's been left on, and the actual temperatures.
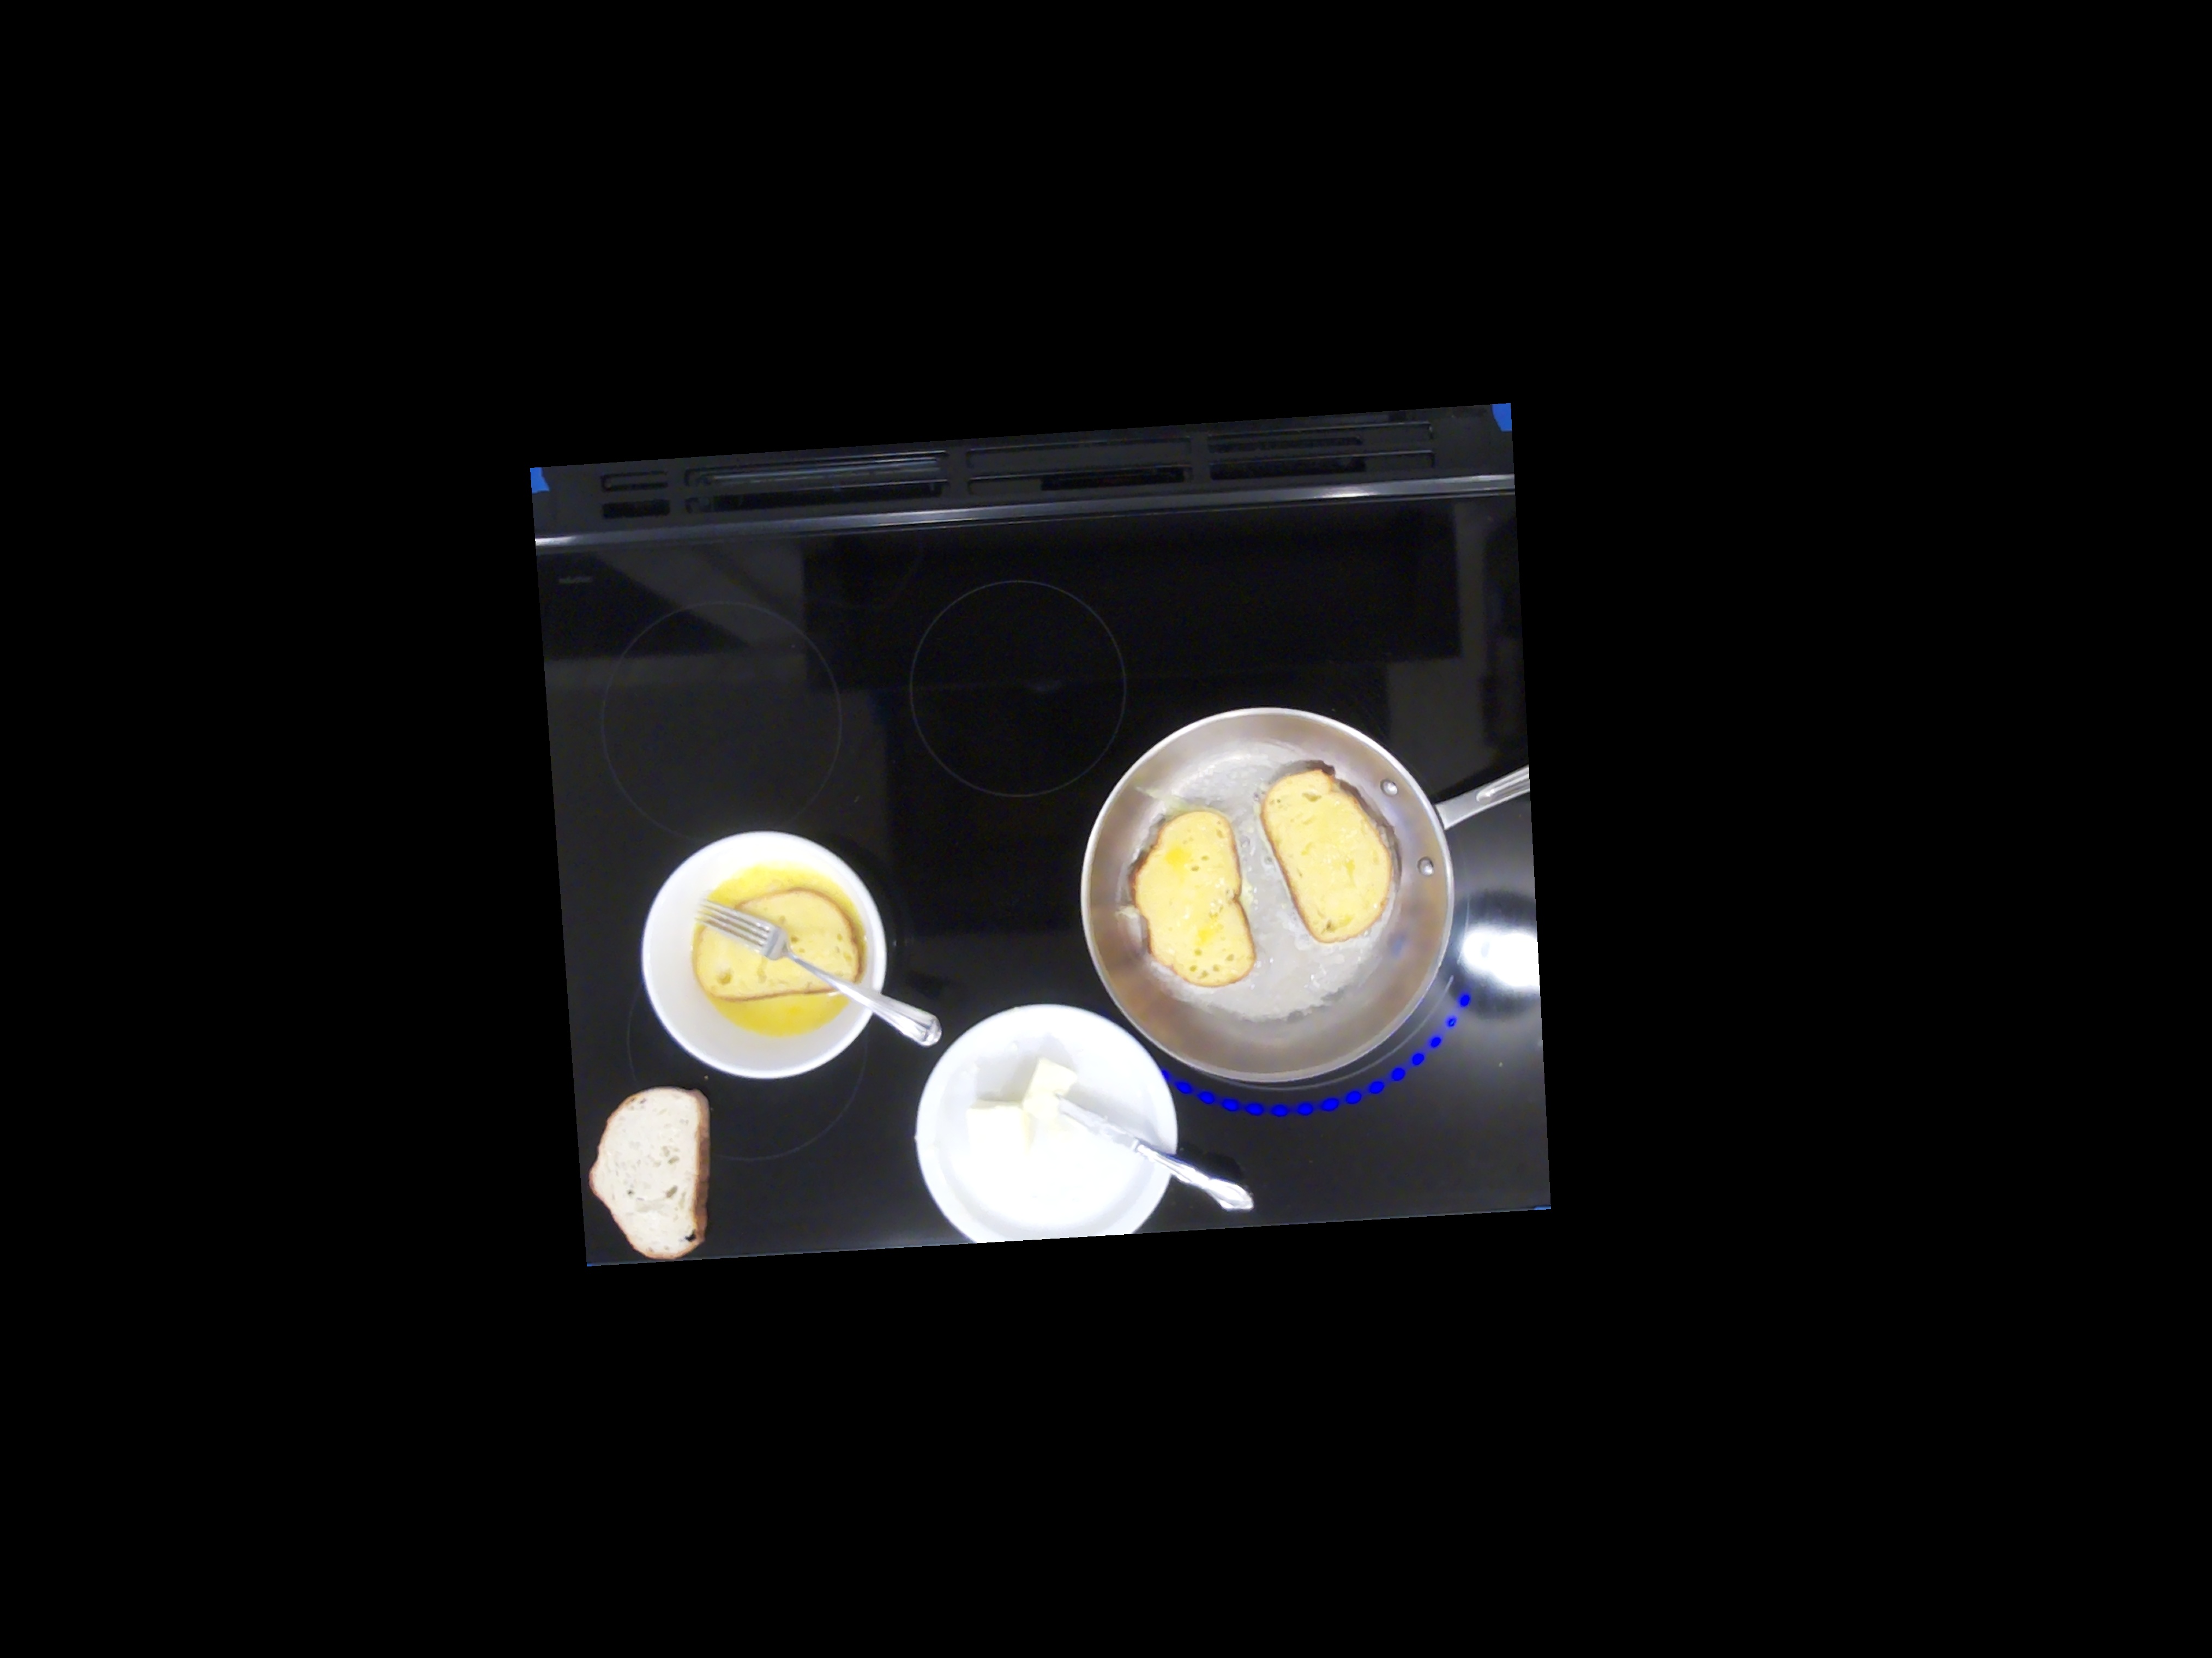
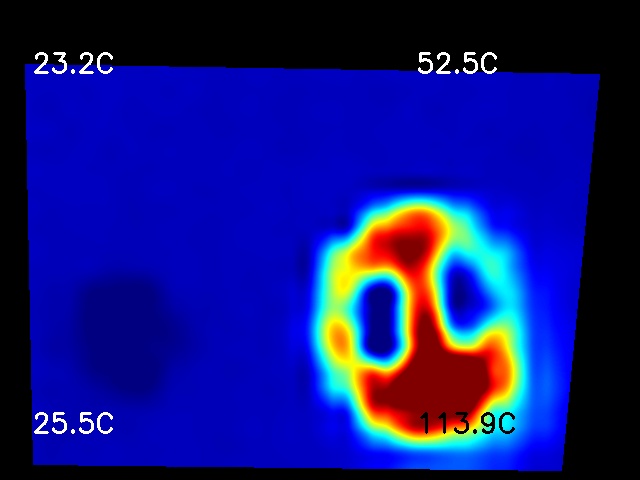
RGB French toast cooking in a stainless skillet — the model reads the cookware, the food, and the front-right burner.Thermal The same instant in IR — the pan core reads 113.9°C while the toast stays cooler where it absorbs heat.
The most common thing the model saw across the whole dataset was a covered pot.
Those are exactly the moments the thermal camera pulls its weight: you can't see
the food, but you can still see the heat.
03
A three-stage pipeline
Running a top-end AI model on every photo would cost a fortune. So each capture
goes through three steps, and only the photos that matter make it as far as the
expensive one.
Stage 1
Brightness gate
A quick check on the device itself throws out dark photos — lights off, nobody home — before any AI runs. This alone drops most of the captures.
$0 · on-device
Stage 2
Cooking screening
A small vision model on LBNL's CBorg service answers one yes/no question: is anyone actually cooking?
cheap · cooking / not
Stage 3
Full identification
Only the photos that pass step two reach the best model (Gemini), which writes down the food, how it's cooked, the cookware, the burner, and how sure it is.
premium · rich labels
Step three writes one record per cooking session, and more than one when
several burners are going at once. It covers the method (boil, simmer,
sauté, pan-fry, deep-fry, bake, broil), which burner, and the cookware.
04
Worked examples
Two real captures that scored a perfect 10/10 when we graded them. Each one shows
the two photos that went in and the record the model wrote out, including the notes
it left for itself.
Result · ID 230910/10
RGBThermal
Food
French toast
Method
Pan-fry
Cookware
Skillet
Burner
Front right
Confidence
1.00
“French toast is actively cooking in a skillet on the front right burner. The thermal image confirms high heat under the pan, with cooler spots where the bread absorbs the heat.”
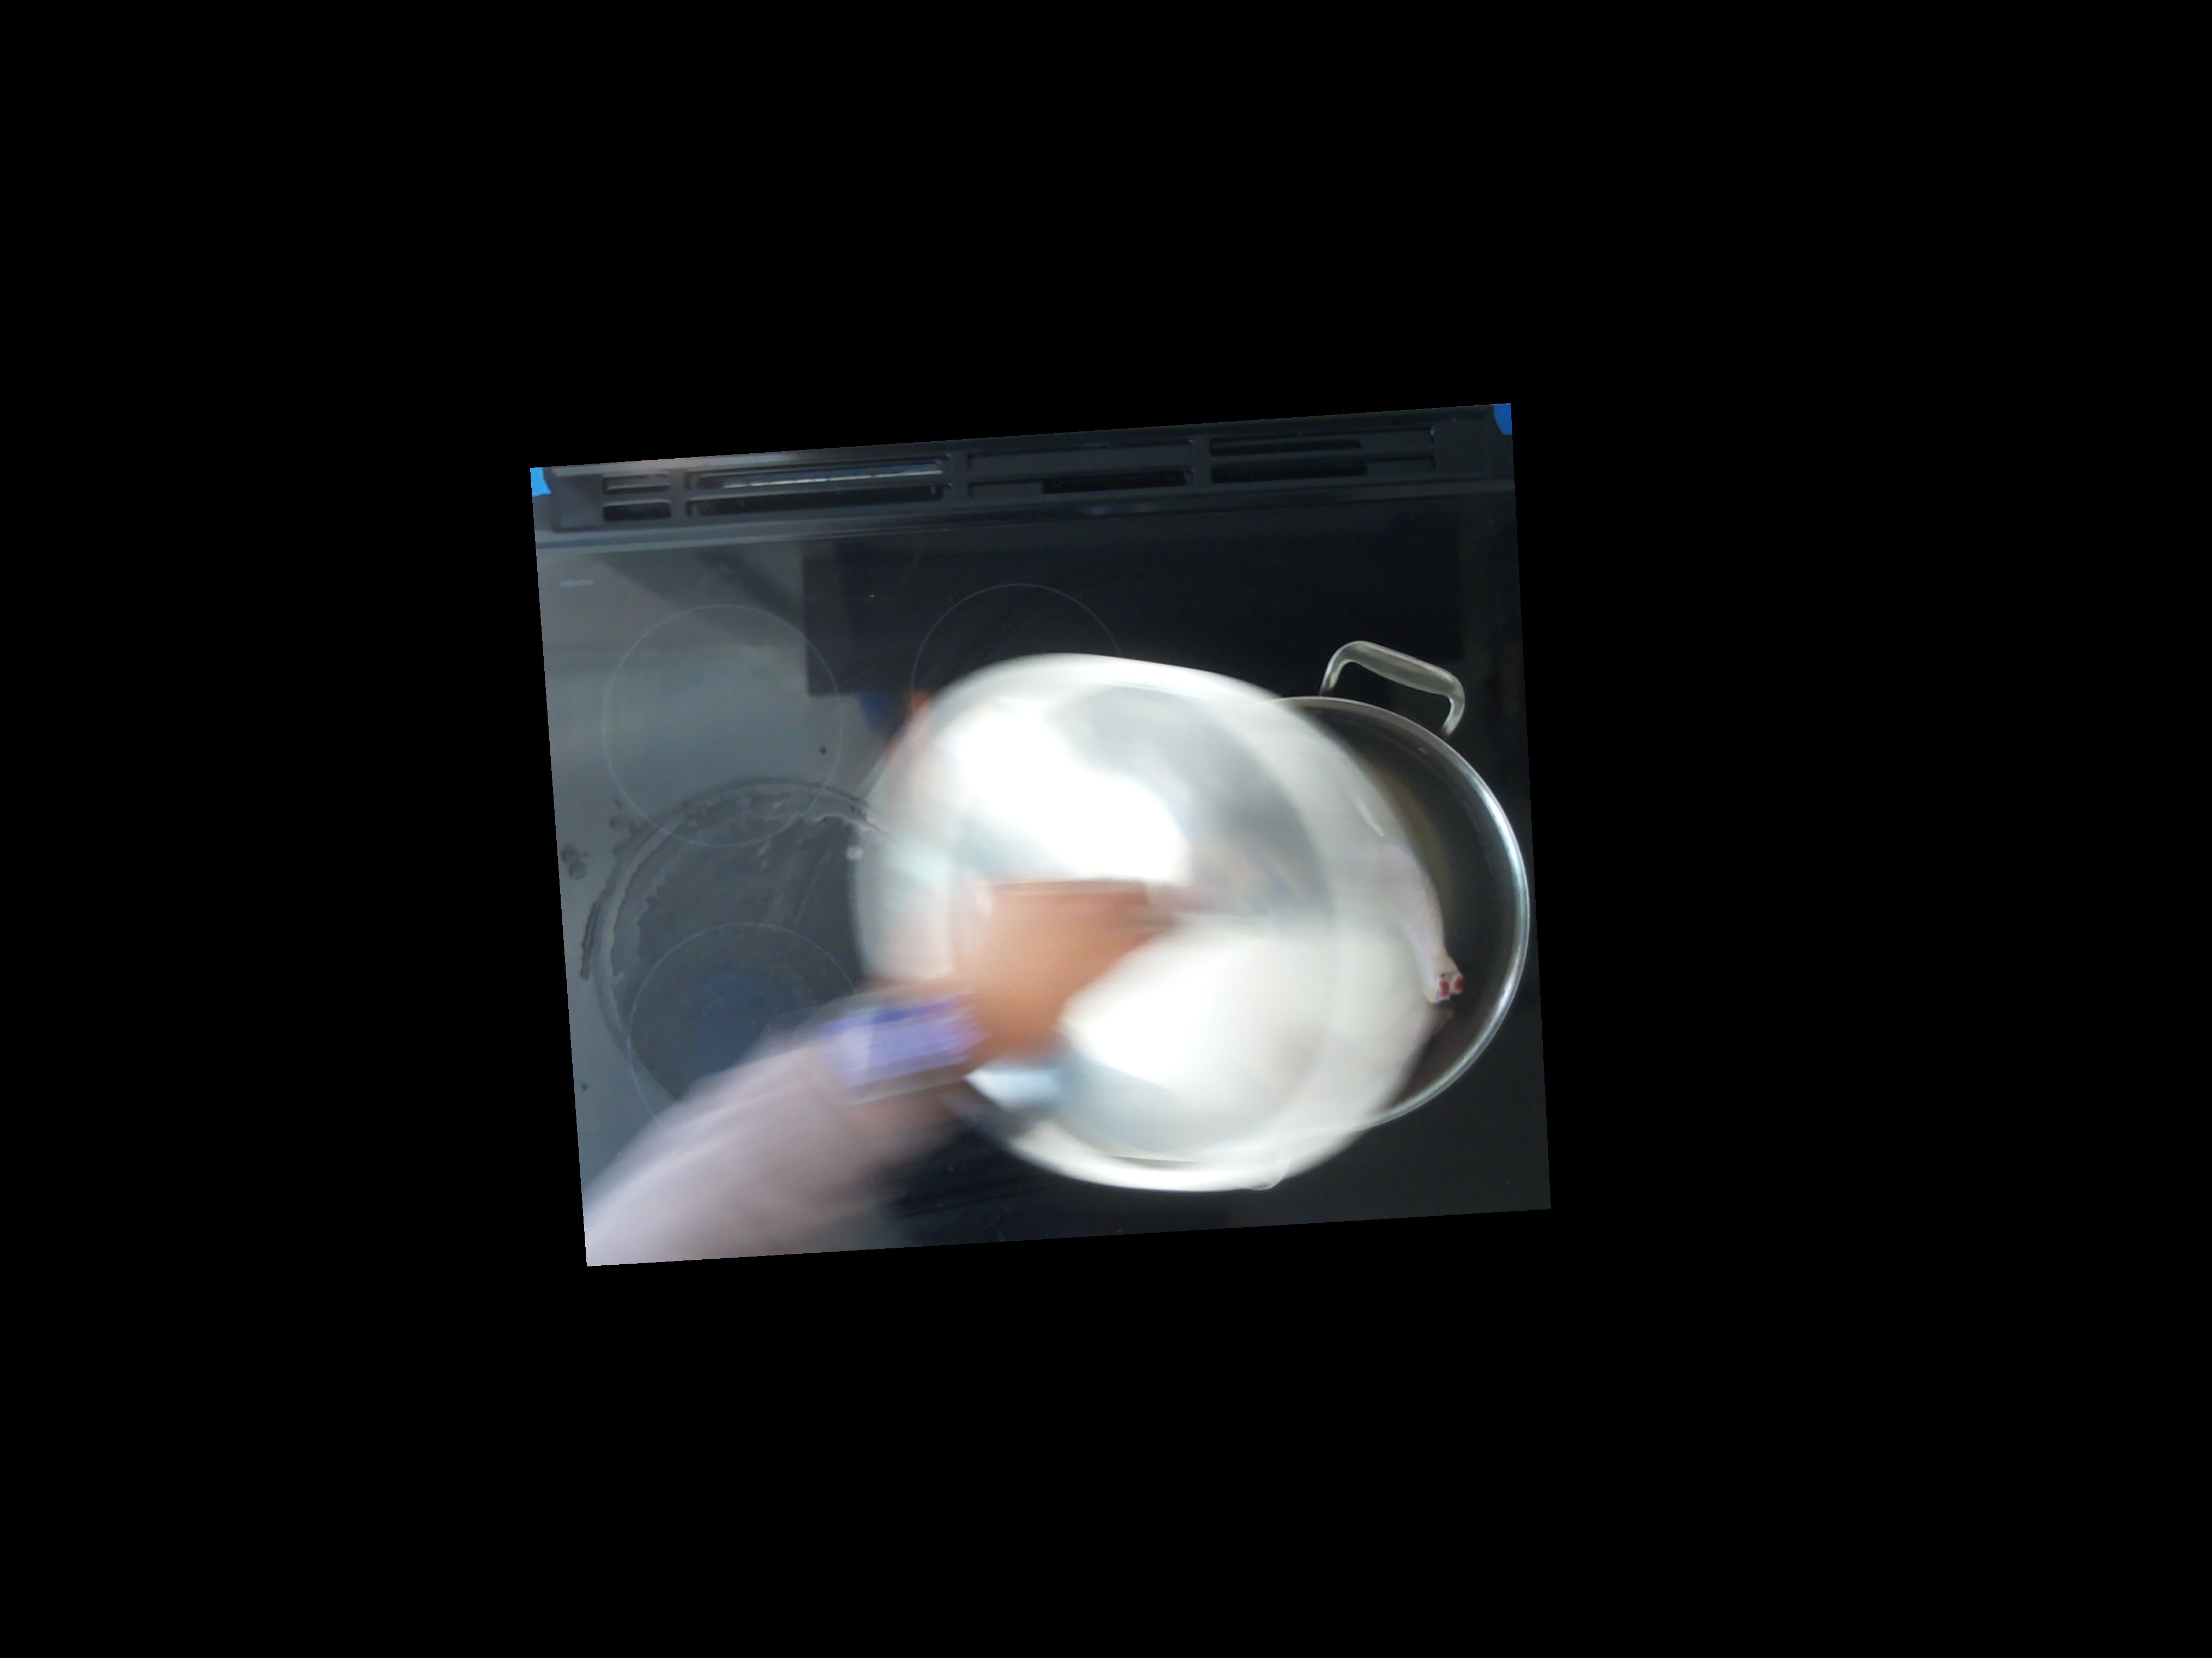
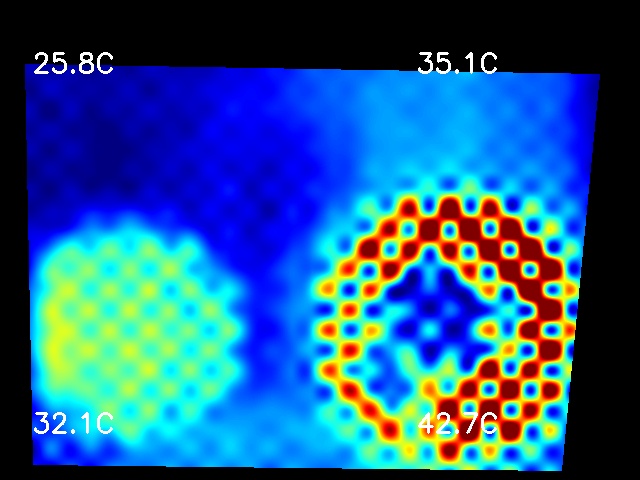
Result · ID 238510/10
RGBThermal
Food
Chicken
Method
Boil
Cookware
Pot
Burner
Right
Confidence
0.95
“A person is handling the lid of a large pot on the right burner. Raw chicken is visible inside. The thermal image confirms a strong, ring-shaped active heat signature under this pot. The left burner shows residual heat but is empty in the RGB image, so it is excluded.”
The second one is the interesting case. There's motion blur, a hand in the shot,
and a covered pot — but the model still puts the two photos together, using the
normal photo to rule out the leftover heat the thermal camera picks up on
the empty left burner.
05
Checking the AI against people
To see whether the labels were any good, we went through 506
random photo pairs by hand, scored each out of 10, and noted what kind of mistakes
turned up. The model averaged 8.1/10, with 66%
scoring 8 or higher and 32% we couldn't fault. When it does get
it wrong, it usually thinks cooking is happening when it's really just leftover
heat — and for an air-quality study, that's the safer way to be wrong. And in
all 506 pairs, it never once mixed up the burner or the cooking method.
How the 506 hand-graded captures scored. The cluster at 5 is almost entirely false positives — 122 of those 125 are residual-heat calls.
06
How it reads a stove — and where it breaks
The model doesn't really "see" the way we do. It shrinks each photo, cuts it into
small patches, and turns every patch into a list of numbers. Those numbers sit in
the same space as words, so a round metal shape with a handle ends up
near "skillet," and a bright ring in the thermal photo ends up near "hot burner."
Because it was trained on huge piles of labelled food photos, overhead cooking
clips and thermal images, it can even read the little temperature numbers
printed on the IR frame.
Where it falls down. The model is matching patterns, not
understanding physics, so a strange scene it hasn't seen before can fool it. It's
also biased toward Western food: it nails a plate of salmon or French toast where
everything sits separately, but a wok full of mixed, blurry stir-fry is much
harder. It gets chicken right nearly every time; jackfruit, almost never. Writing
down where and why it fails is a real part of the project, not a
footnote.
Mean grade by food (foods with four or more graded captures). Dishes the camera can actually see score perfect; the muted bars — covered pots and unknowns — sit at the bottom.
07
Where it goes
The main point of the project is the method — building cheap sensors from this
kind of paired data for air-quality and building research. But once you have a
record of what's being cooked, it's useful for a lot of other things too:
01Exposure science
Quantify cooking frequency, duration, and method to model indoor pollutant emissions without intrusive lab gear.
02Elderly care
A daily heartbeat summary — "Mom used the stove for 20 minutes this morning; it's now off."
03Compliance
Left in a commercial kitchen, it can help verify food is cooked to adequate temperatures.
04Energy
Compare ambient heat wasted by gas vs. electric stoves using the thermal channel.
05Macros
A heat-aware alternative to photo-only calorie apps, using the cooking process as signal.
06Economics
Cooking habits — the ratio of meat to vegetables, when households cook — as a ground-level indicator.
08
Status & publications
Target venueISES 2026 — Int'l Society of Exposure Science (Vancouver), abstract due Apr 30 2026
Also exploringHealthy Buildings 2027 (Amsterdam)
TeamJonathan Earp & Noah Sohn — advised by David Lorenzetti & Michael Sohn (LBNL)
Built onRaspberry Pi 5 · Adafruit thermal camera · LBNL CBorg · Gemini vision
In progressSessionization — feeding prior frames as context so the model can track a dish over time
02ArchiveEarlier research
2024UPenn ESAP
Nanotechnology & Device Fabrication
NanoscienceCleanroom ISO-5Lithography
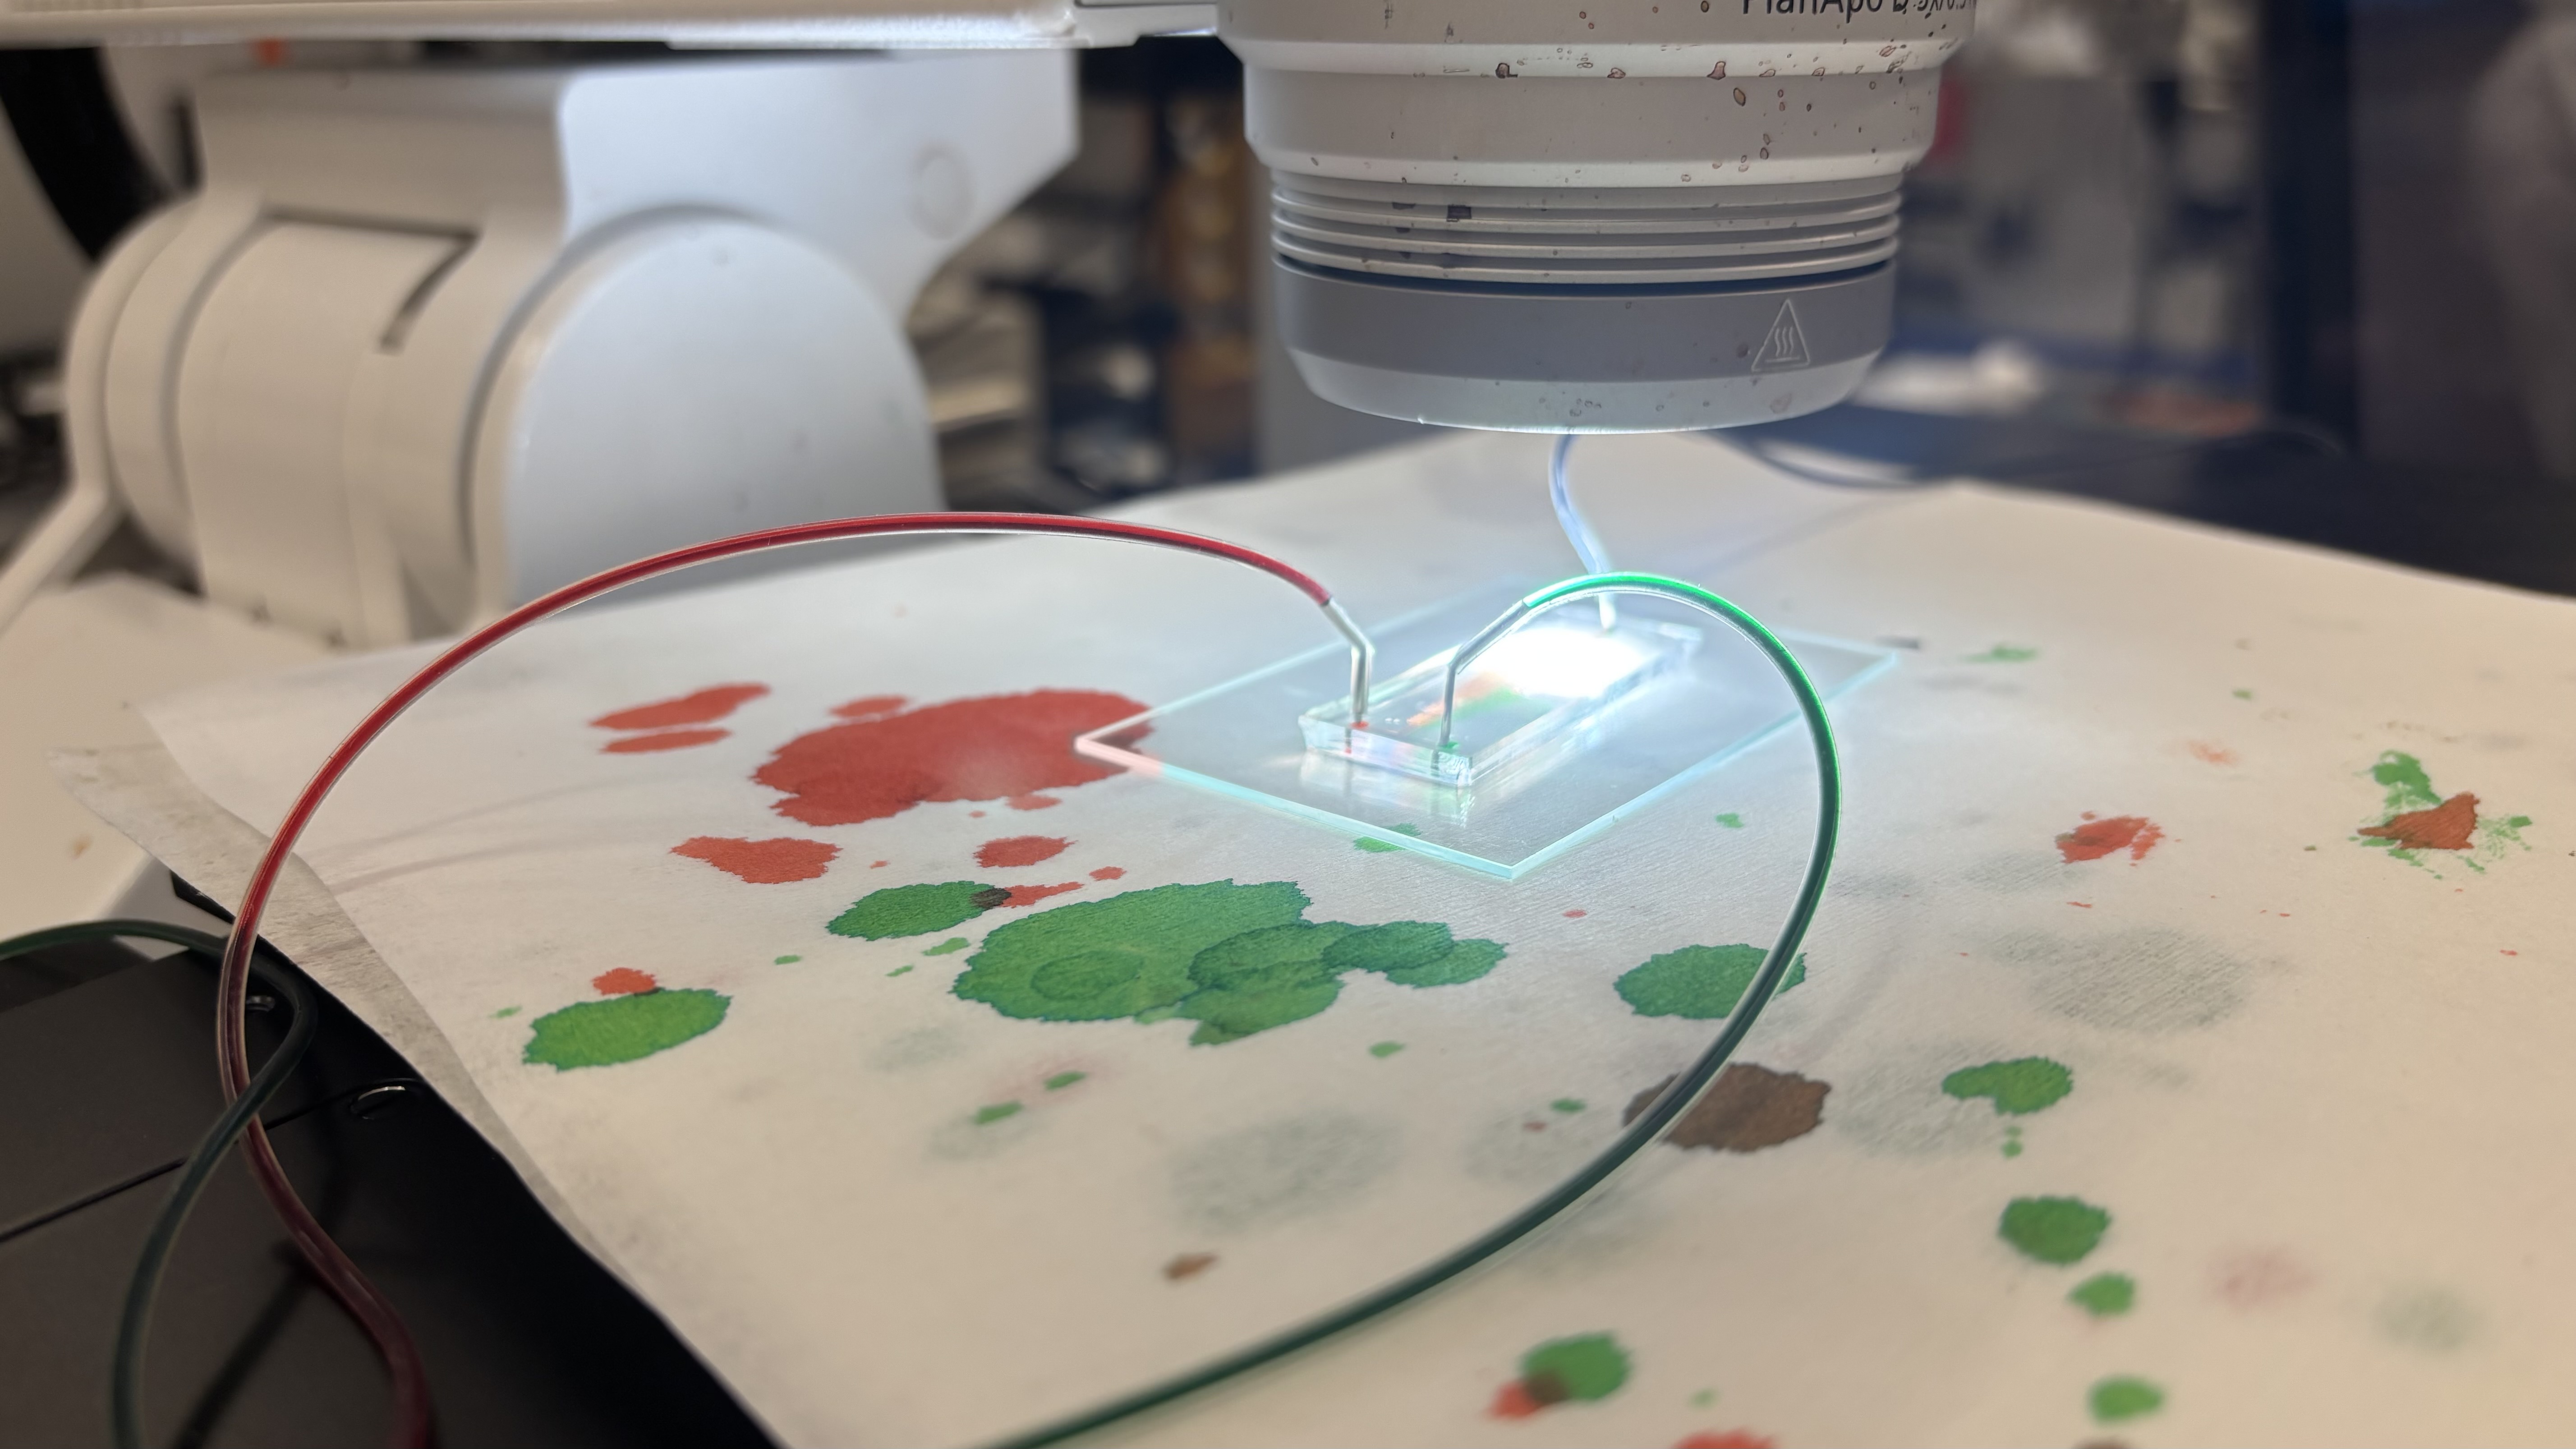
An intensive fellowship on the fabrication and characterization of nanoscale
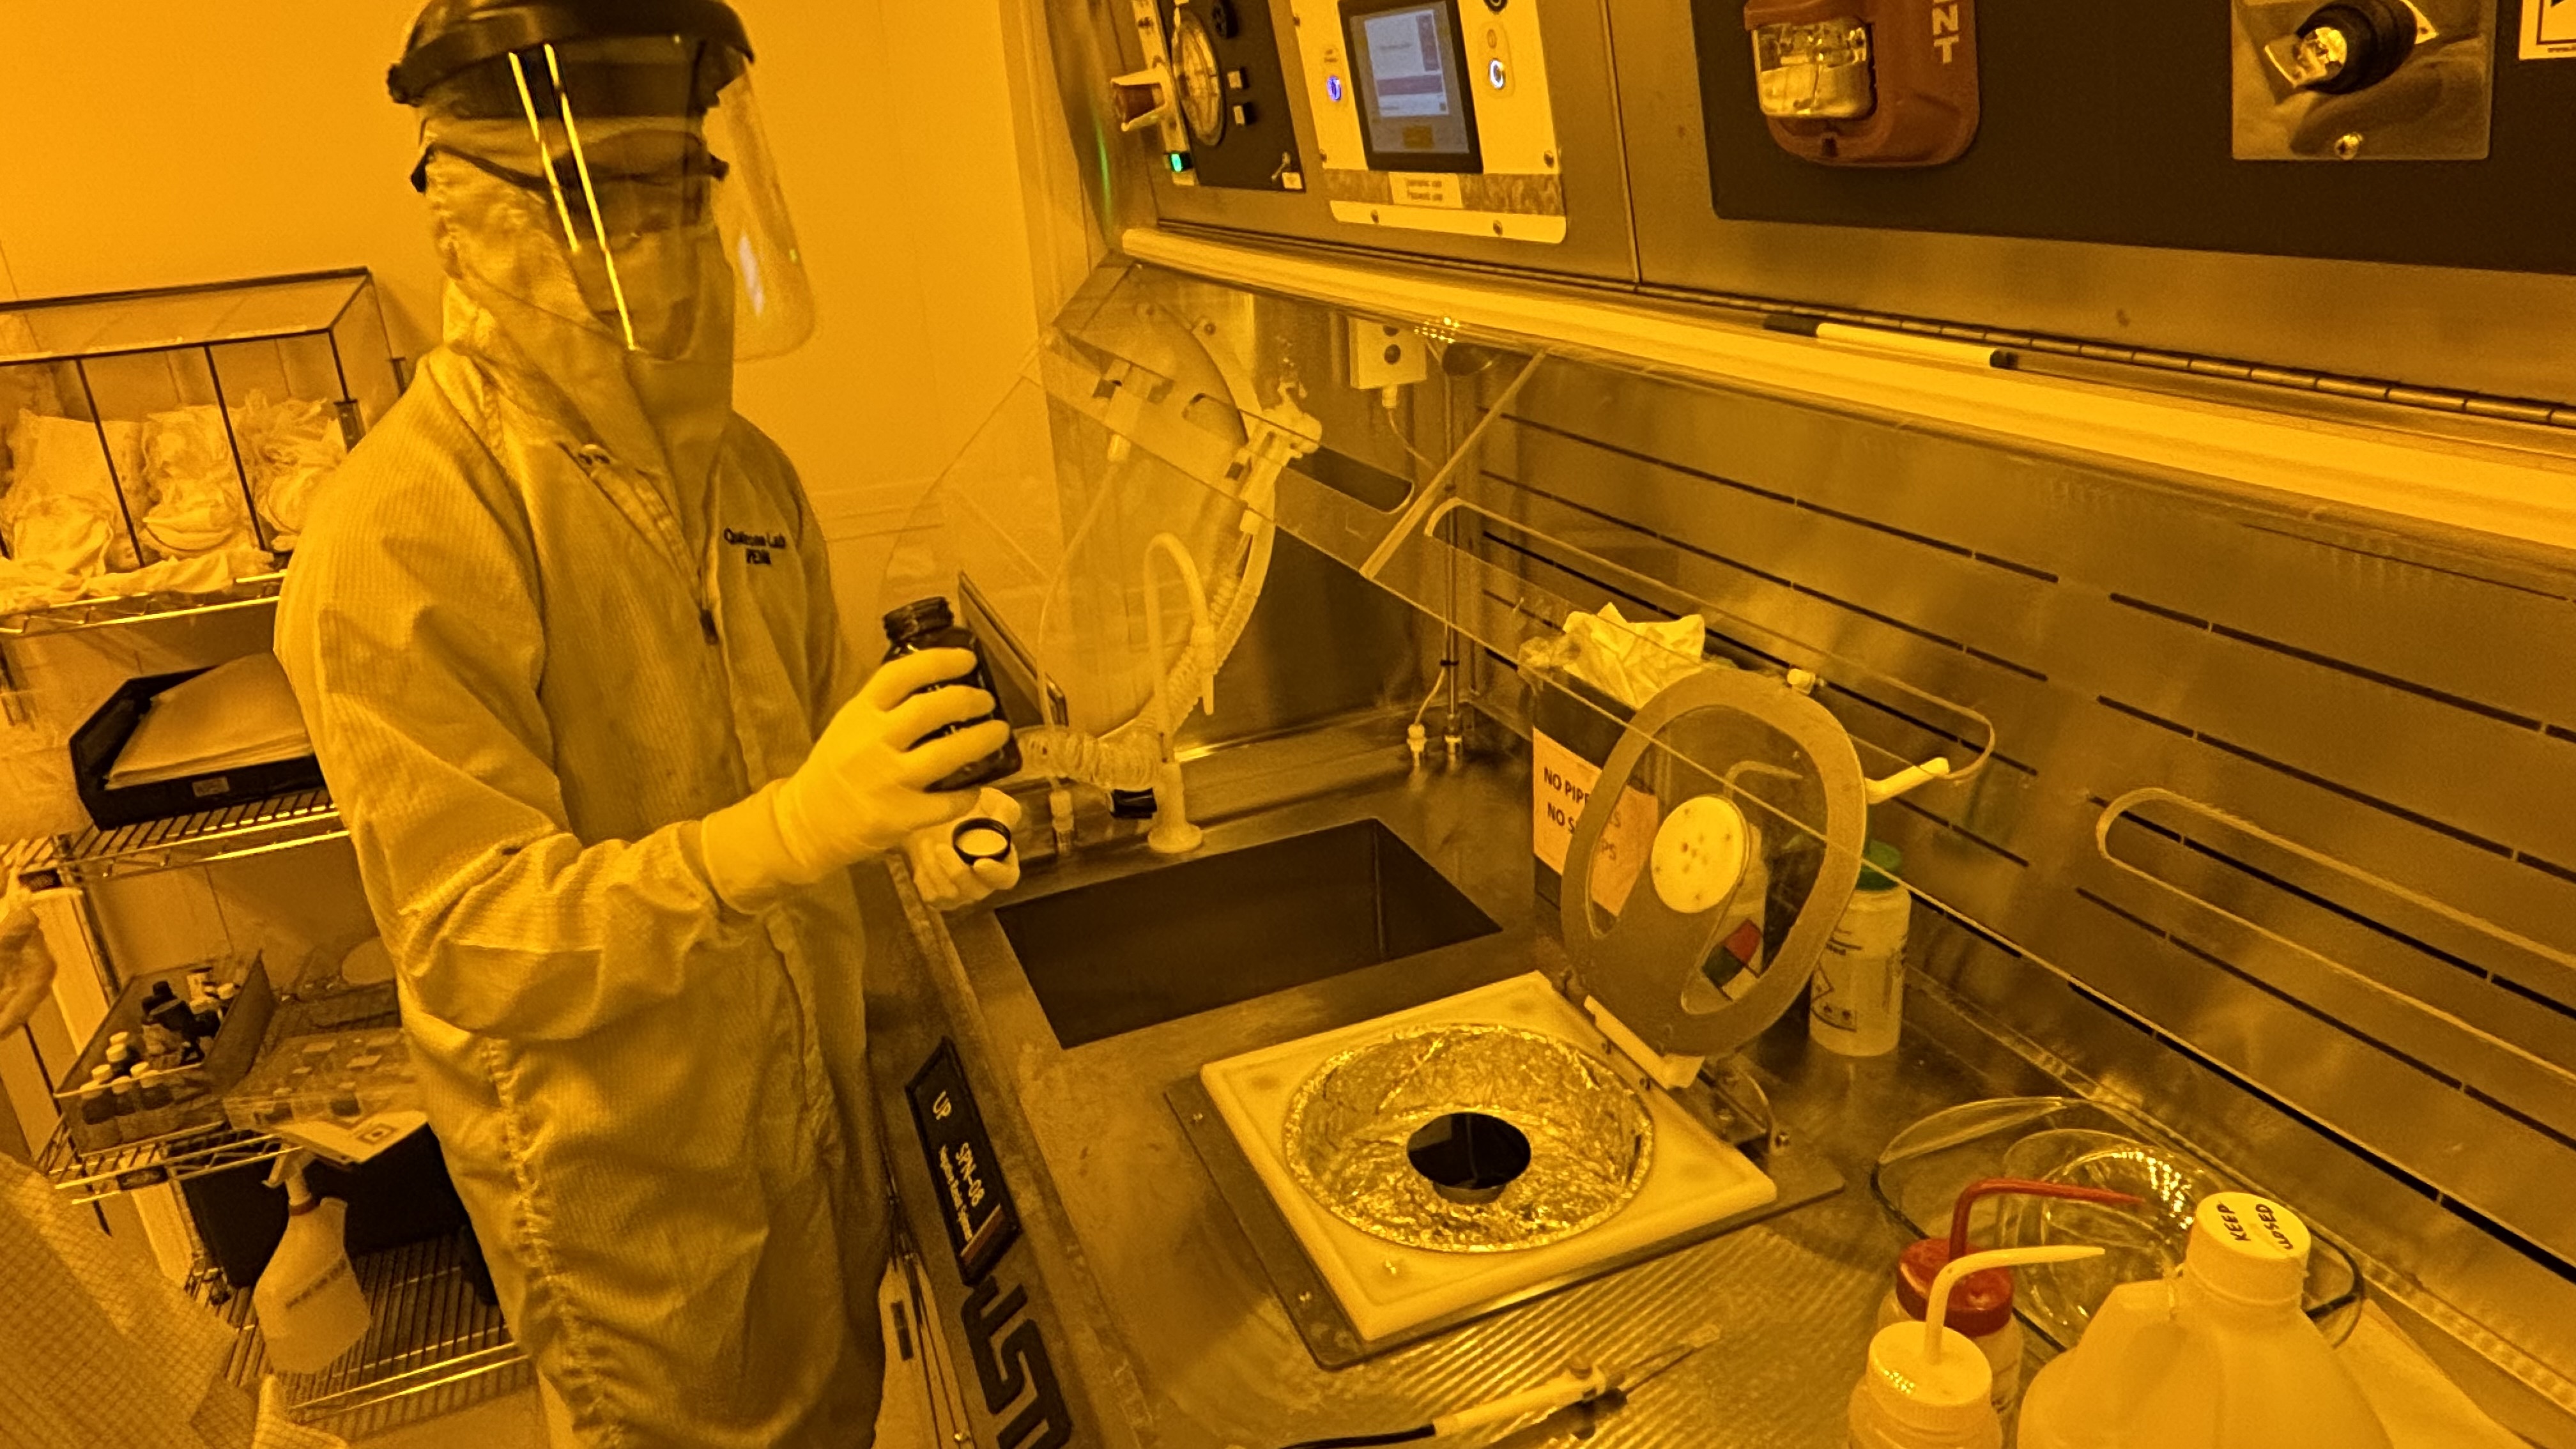
devices — processing silicon wafers in a Class 100 cleanroom with advanced
lithography.
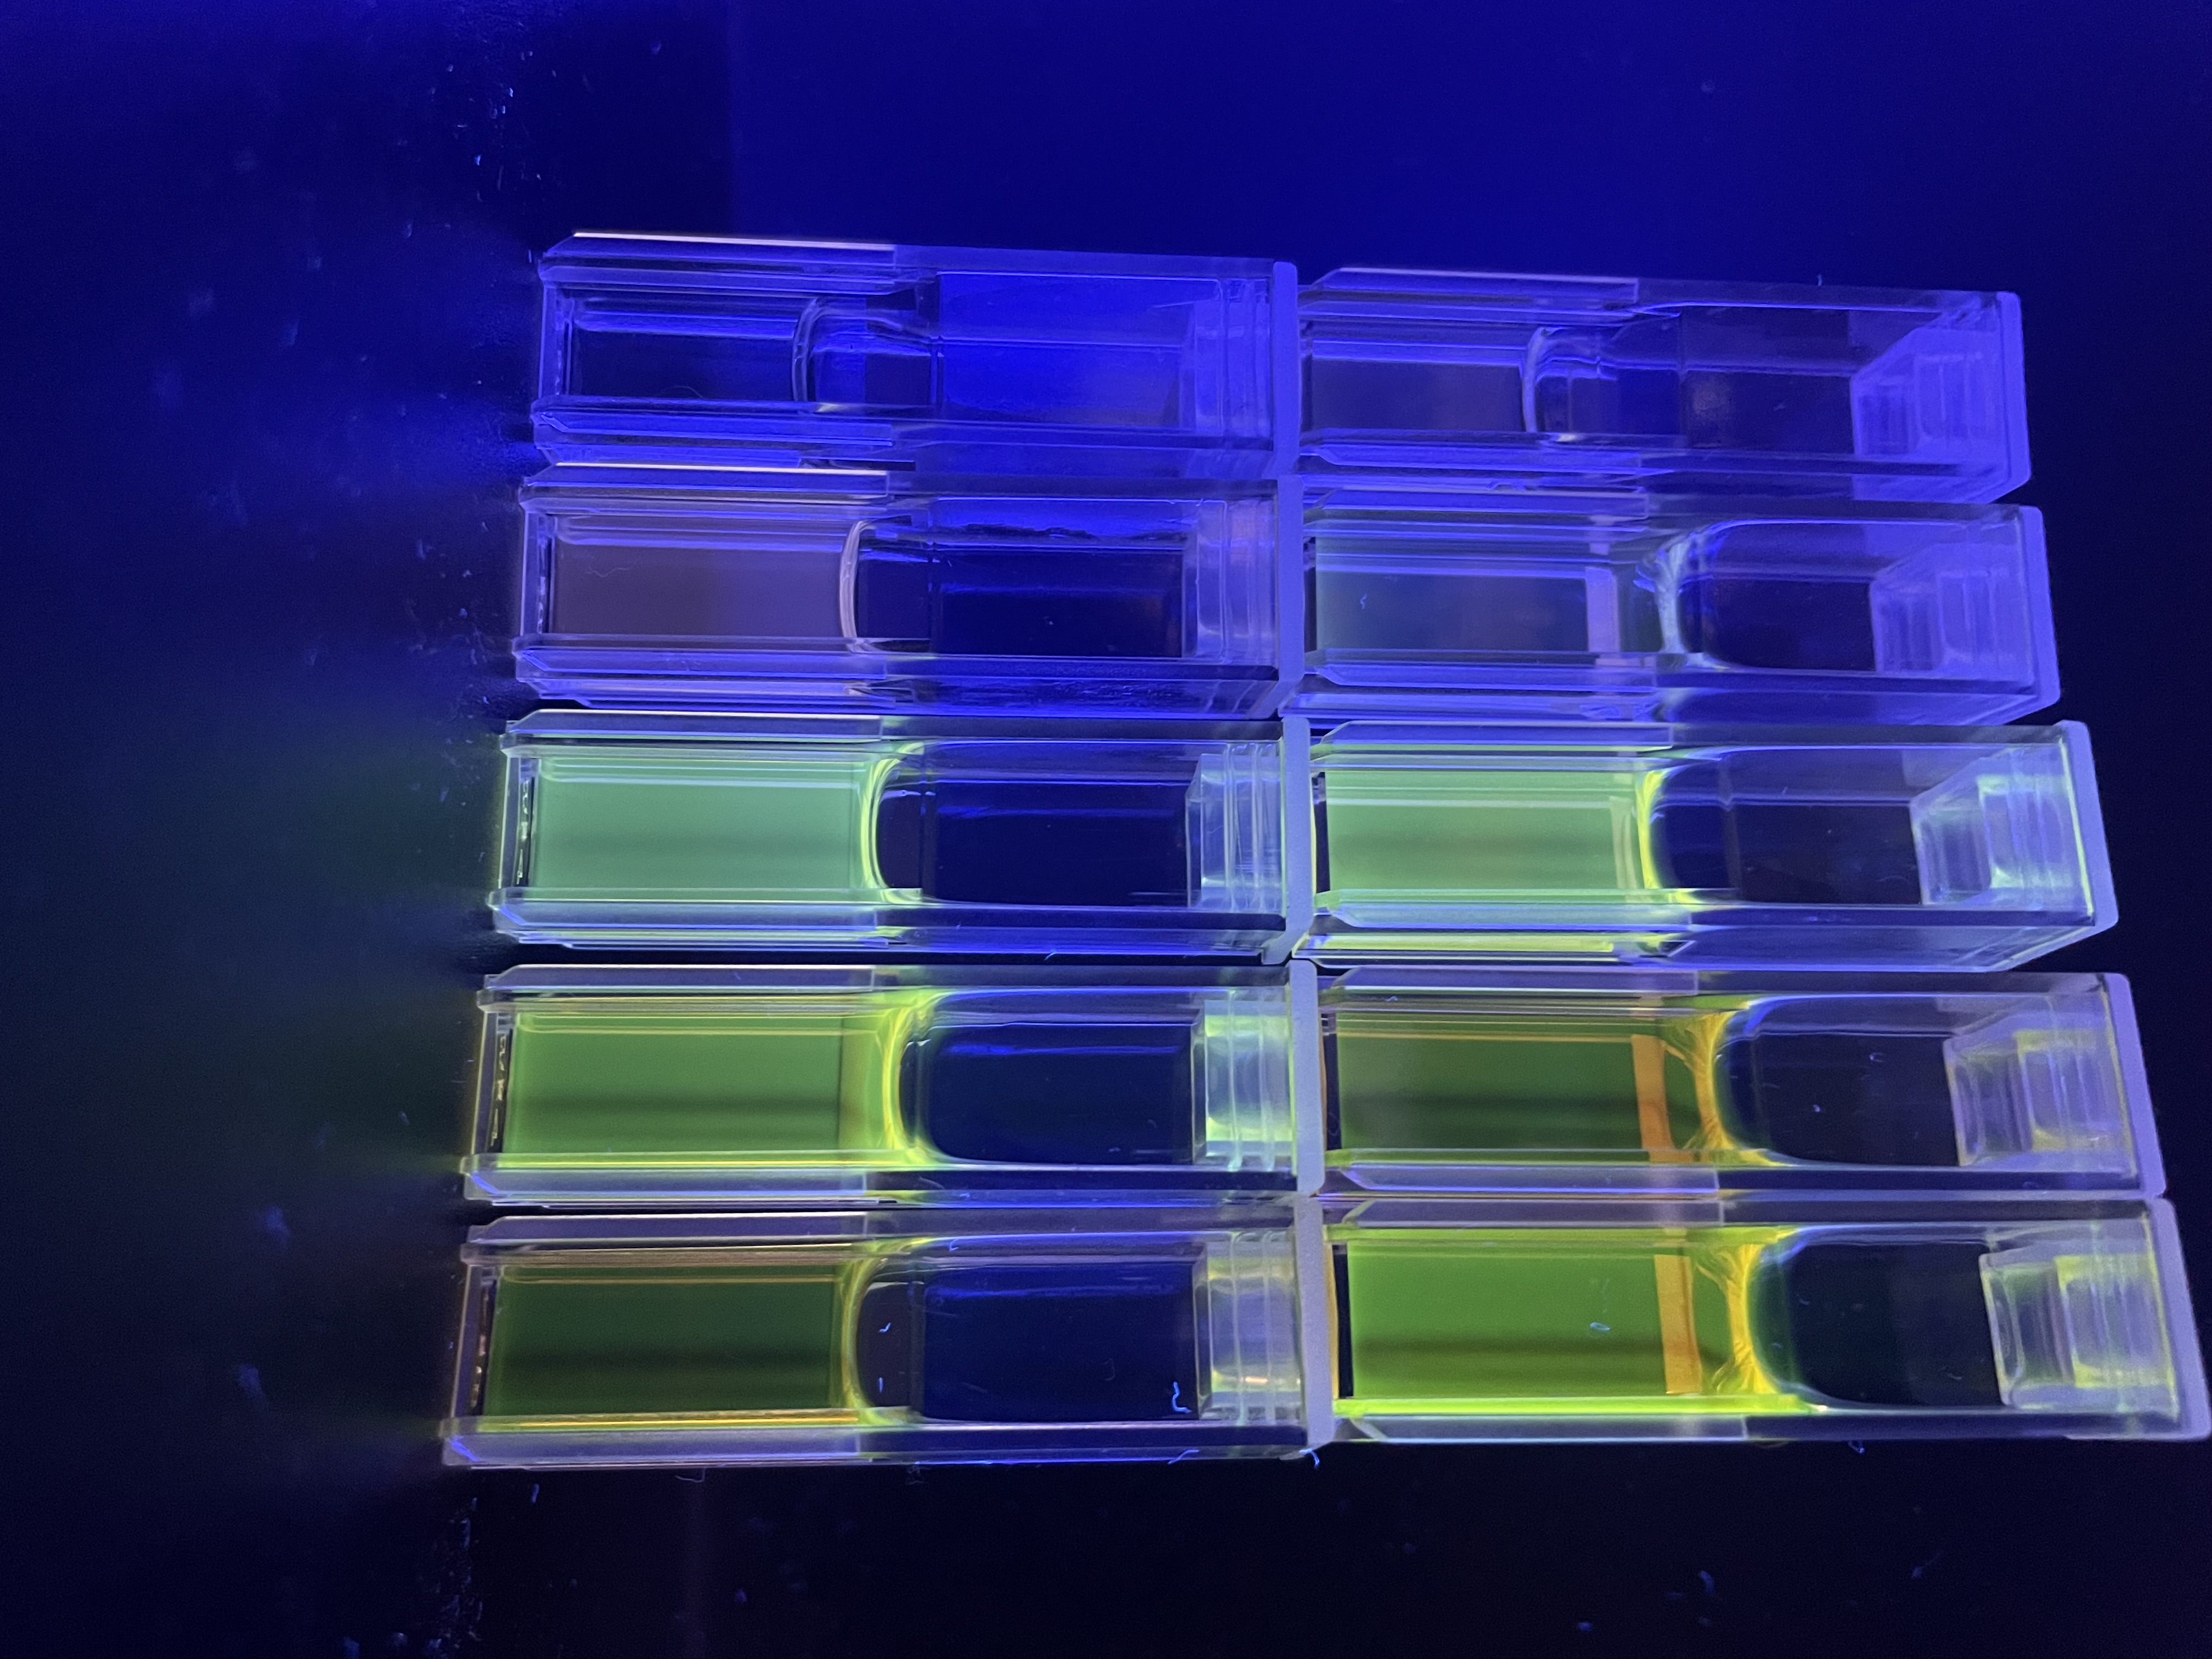
Synthesized gold nanoparticles and analyzed optical properties via spectroscopy.
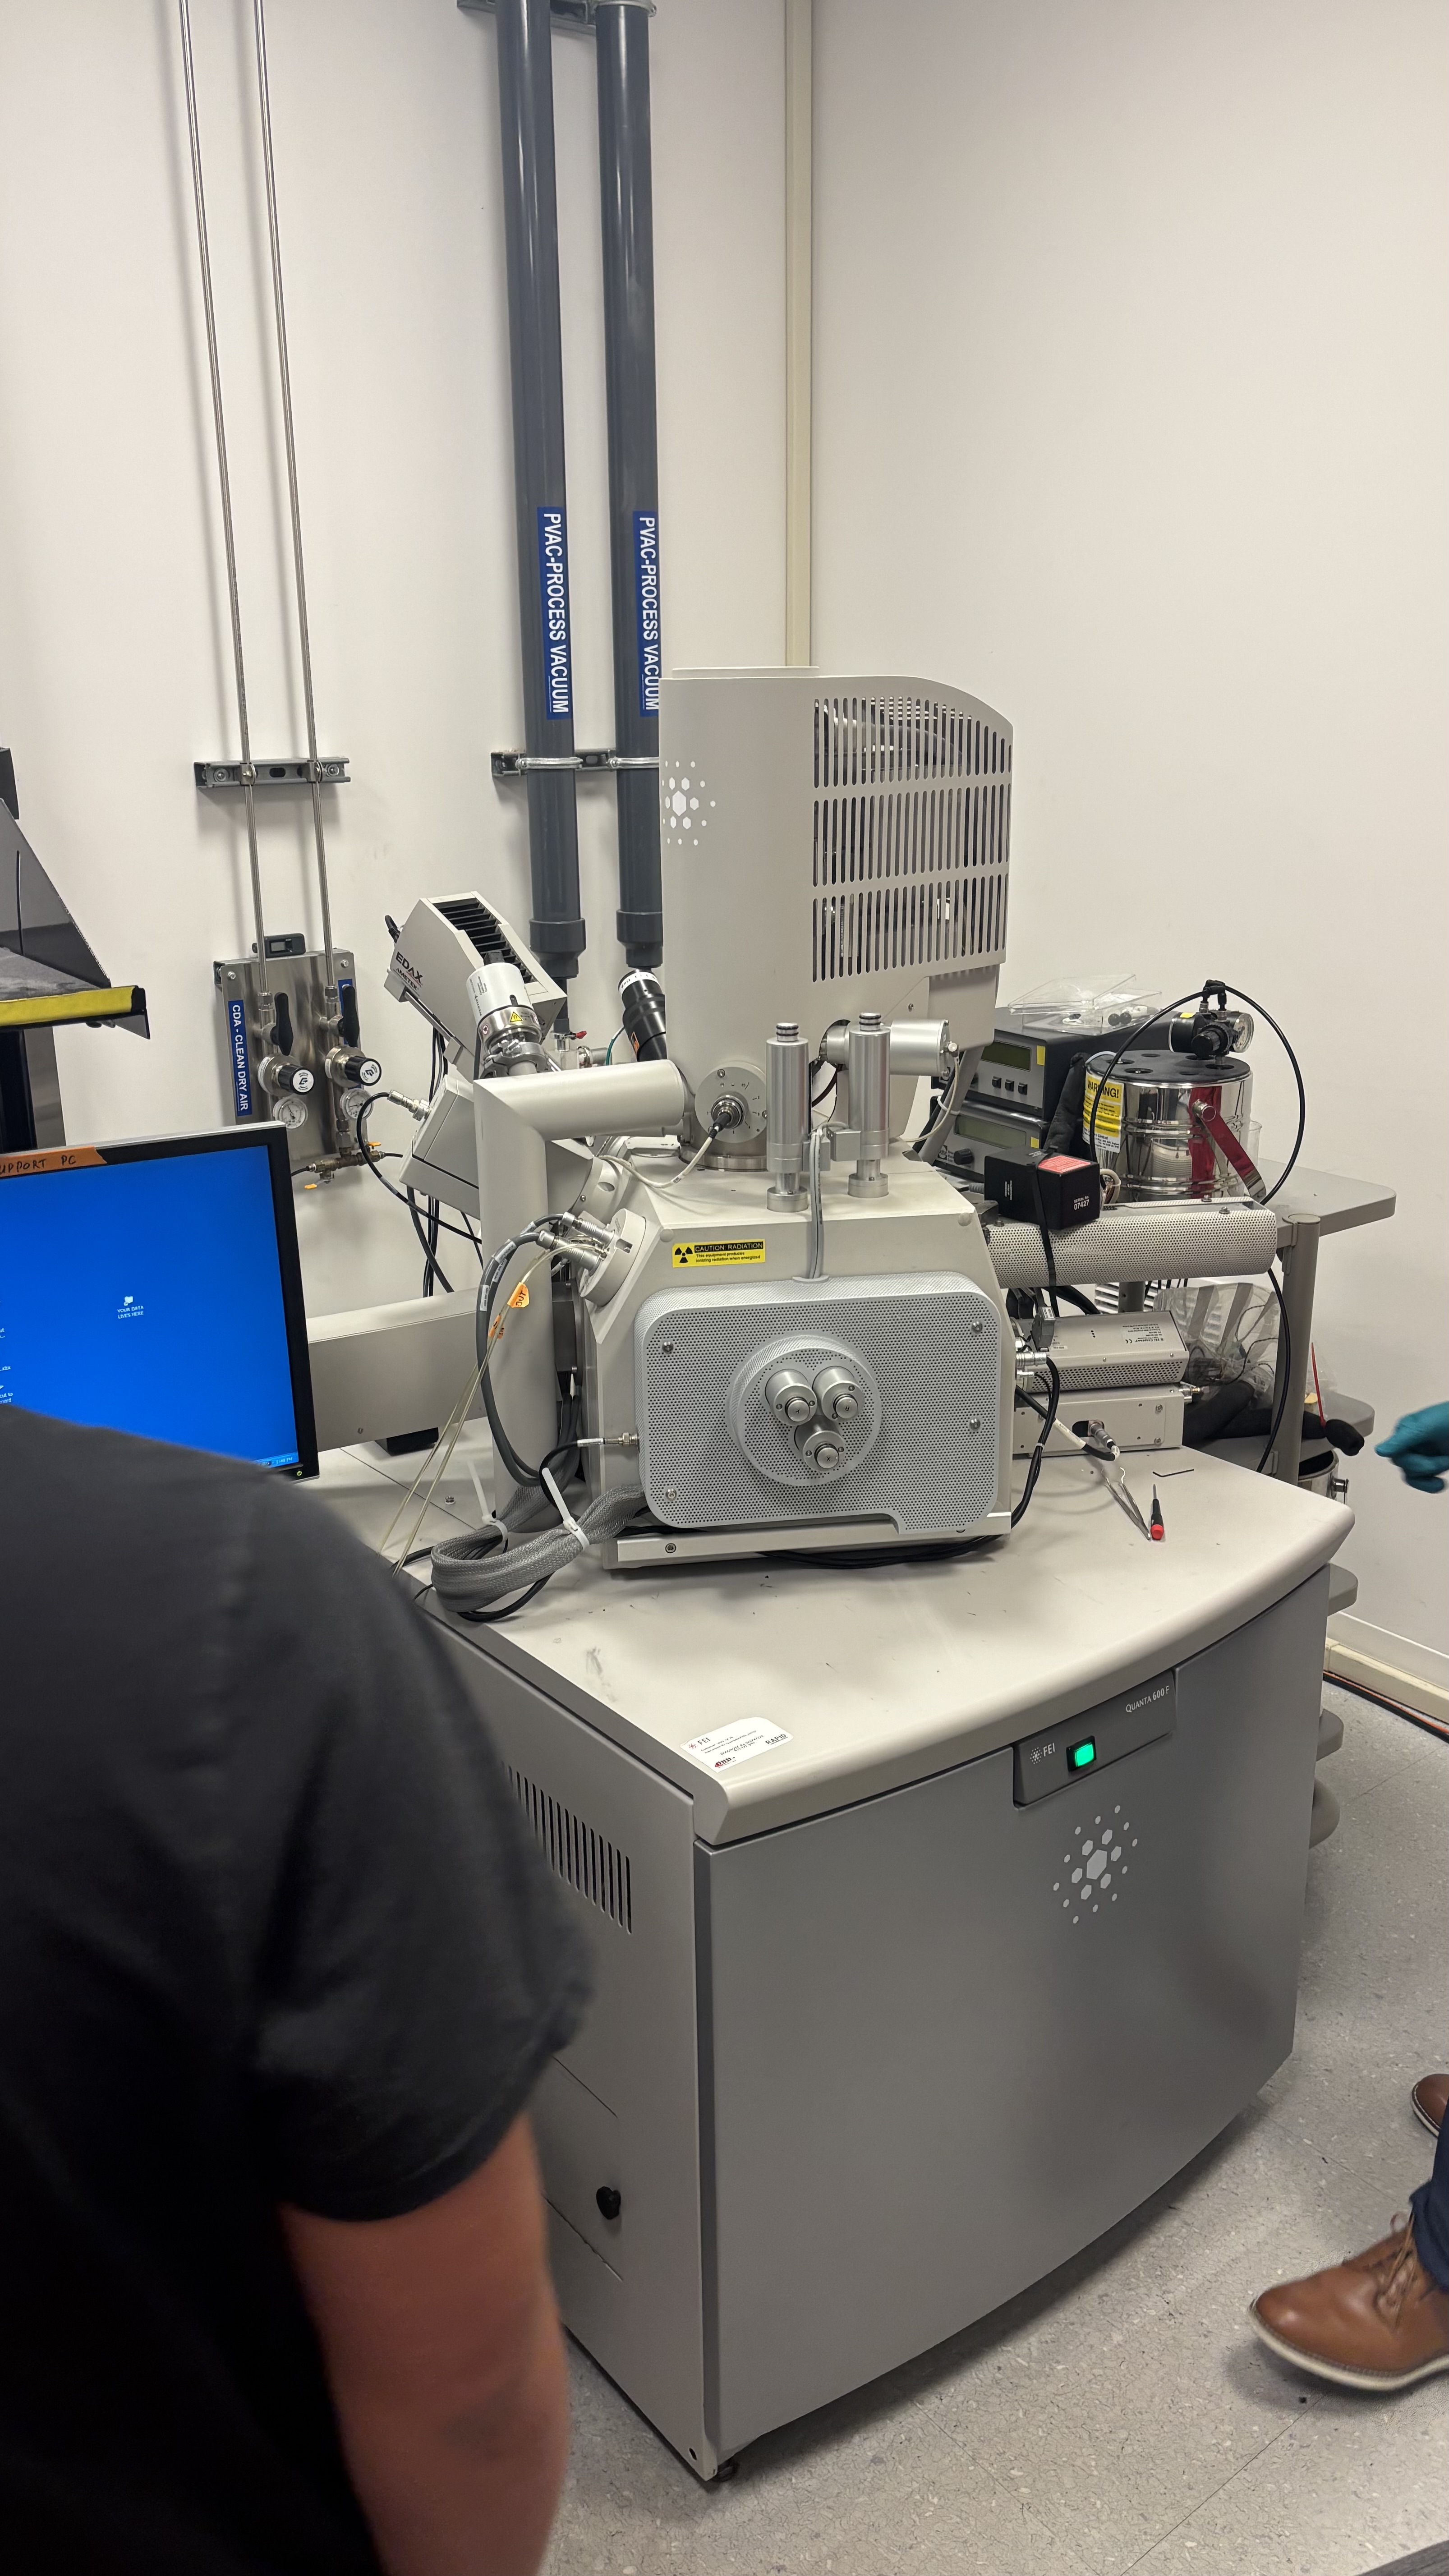
Used Scanning Electron Microscopy (SEM) and Atomic Force Microscopy (AFM).
Developed protocols for thin-film deposition at the atomic level.
Cleanroom protocol — preparing for ISO-5 entry.
SEM imaging — characterizing gold nanoparticle distribution.
Lithography — silicon wafer processing and etching.
Spin casting — applying photoresist to silicon wafers.